


In the stock market, price movements may seem random, but they often follow patterns. Technical Indicators help traders analyze these patterns and make data-driven decisions. Whether you’re an intraday trader, swing trader, or long-term investor, knowing the right indicators can significantly improve your results.
Here are the Top 5 technical indicators every trader must know and how to use them effectively.
1. Relative Strength Index (RSI)
Keyword Focus: RSI indicator, Relative Strength Index, RSI for trading
What It Is: RSI is a momentum oscillator that measures the speed and change of price movements.
How It Works: RSI values range from 0 to 100.
- Above 70 → Overbought (possible price correction)
- Below 30 → Oversold (possible price bounce)
- Pro Tip: Combine RSI with trend analysis to avoid false signals. For example, in an uptrend, focus on oversold levels for buy entries.
2. Moving Average Convergence Divergence (MACD)

Keyword Focus: MACD indicator, MACD strategy, moving average convergence divergence
- What It Is: MACD helps traders spot changes in momentum and trend direction.
- How It Works: It uses two moving averages (12-period EMA and 26-period EMA) and a signal line.
- Bullish Signal → MACD line crosses above the signal line
- Bearish Signal → MACD line crosses below the signal line
- Pro Tip: Use MACD on higher timeframes (1-hour, daily) for more reliable signals.
3. Moving Averages (SMA & EMA)
Keyword Focus: moving averages, simple moving average, exponential moving average
- What It Is: Moving averages smooth out price data to identify trends.
- How It Works:
- SMA (Simple Moving Average): Equal weight to all prices in the period
- EMA (Exponential Moving Average): More weight to recent prices for faster signals
- Pro Tip: Many traders use a combination like 50 EMA and 200 EMA to identify golden crosses (bullish) and death crosses (bearish).
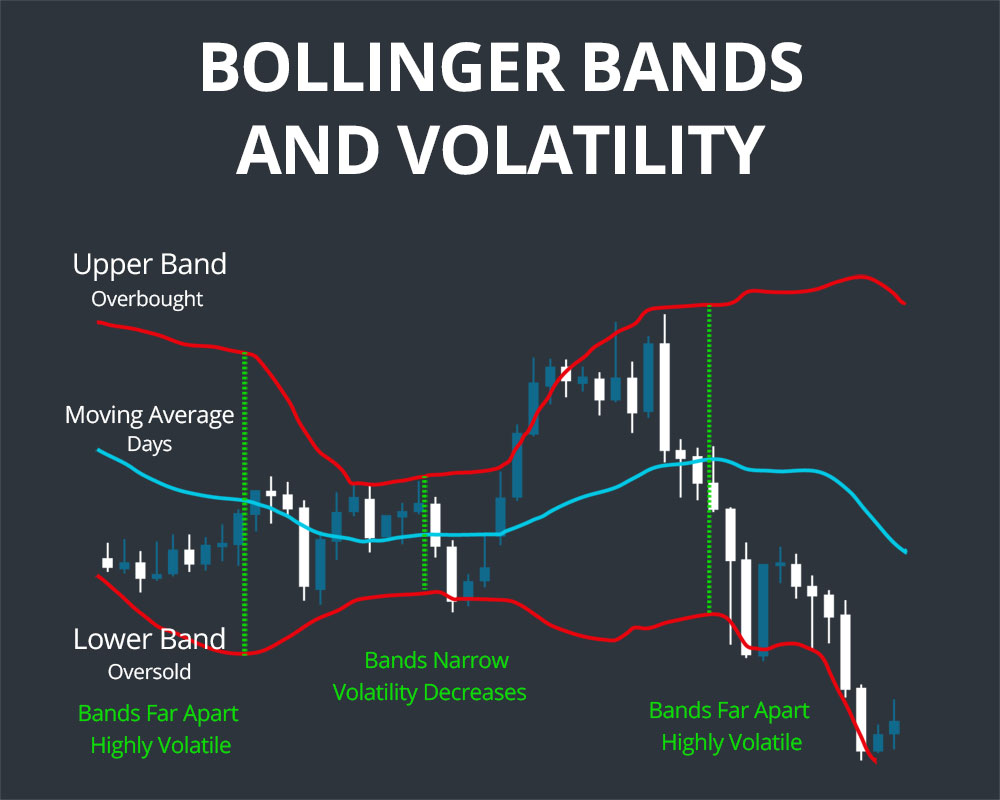
4. Bollinger Bands
Keyword Focus: Bollinger Bands, volatility indicator, Bollinger Band strategy
- What It Is: Bollinger Bands measure volatility and potential price reversal zones.
- How It Works:
- Consists of a middle moving average and two outer bands
- When price touches the upper band → Possible overbought
- When price touches the lower band → Possible oversold
- Pro Tip: During low volatility (bands contract), expect a breakout soon.
5. Fibonacci Retracement
Keyword Focus: Fibonacci retracement levels, Fibonacci trading strategy
- What It Is: A tool to identify potential support and resistance levels based on Fibonacci ratios (23.6%, 38.2%, 50%, 61.8%).
- How It Works: Traders draw retracement levels between a swing high and swing low to find possible reversal points.
- Pro Tip: Combine Fibonacci retracement with candlestick patterns for more accurate entries.
Conclusion
Technical indicators are powerful tools, but remember — no single indicator guarantees success. The best approach is to combine indicators with proper risk management and a clear trading plan. If you’re serious about mastering these tools, join Ra Amit Pande’s Stock Market Trading Institute and learn professional trading strategies from experts.


Hi, this is a comment.
To get started with moderating, editing, and deleting comments, please visit the Comments screen in the dashboard.
Commenter avatars come from Gravatar.